")
")


Turbine Engine Advance Calculation and Health assessment Educational Software
click to see more images
TEACHES is offering the possibility for gas turbine engine simulation and fault diagnosis using the Adaptive Modeling technique. By appropriate selection of input data it can perform either direct simulation of engine operation at any desired operating point (‘Simulation mode’) or a diagnosis of the condition of the engine components, once a set of measurement data is available (‘Diagnostic mode’).
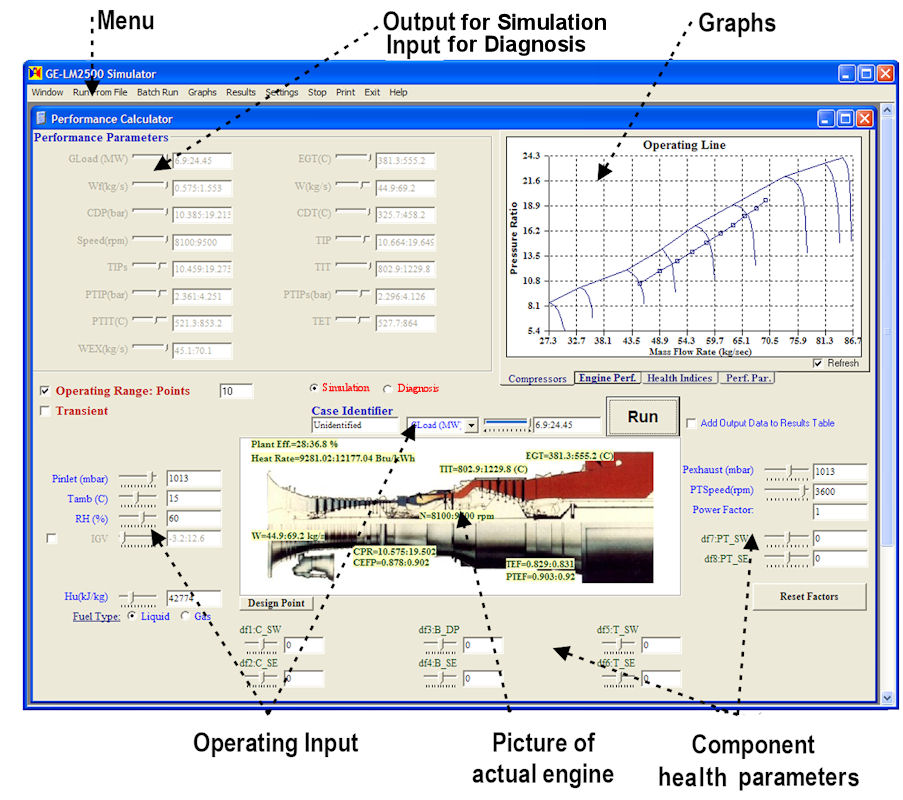
The GUI interface, allows the user to choose between different modes of operation and to perform various tasks with input and output information. The interactive main window is used to control the most common actions and to get the most significant information from the calculations. Less common functions are available via a menu system.The two modes of program operation - Simulation and Diagnostic- are selected from this window.
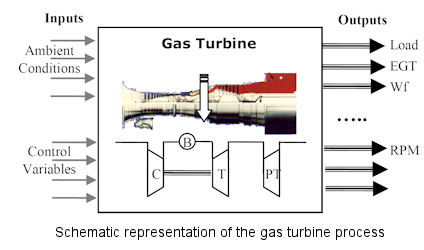
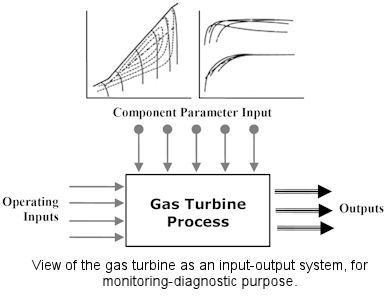
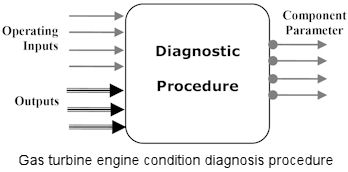
The role of different sections of the interface is different for different mode of operation. Operating point data are always inputs. They include ambient conditions and a set point variable chosen from a menu offering different possibilities. The values of measured quantities are outputs in the ‘Simulation’ mode, while they are inputs for the ‘Diagnostic’ mode, when measurement data are used to produce a diagnosis. Component parameters are inputs when component malfunctions are simulated and outputs when a diagnostic run has been performed with measured input data.

The overall structure of this modeling package is characterized by modularity in three levels:
- The code for the GUI is modular, so different engines can be modeled by supplying a different DLL.
- The code of the DLL is built by using individual subroutines for each type of component, so that the engine layout can be easily modified.
- For a DLL built for a certain gas turbine configuration (single-shaft, twin-shaft etc), engine data and component map data can be provided to represent different individual engines of this type.
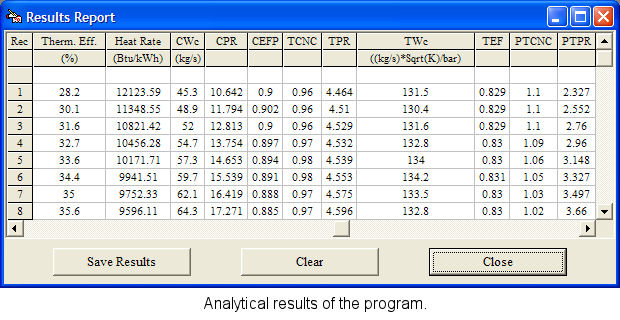
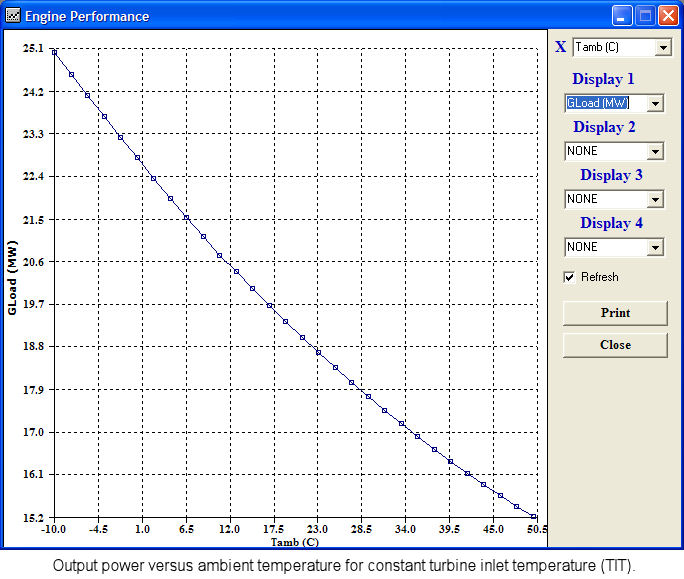
Examples of Results
Examining the Effects of Component Malfunctions.
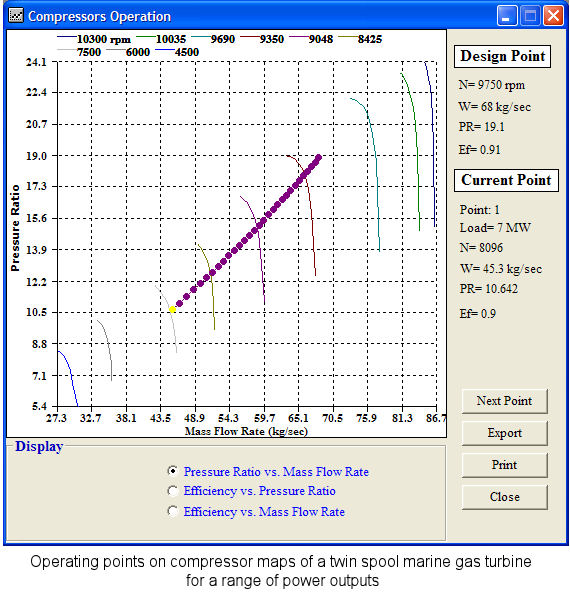
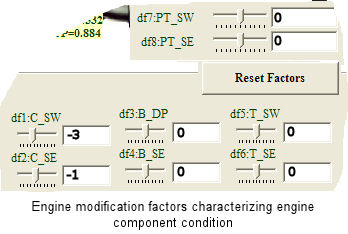
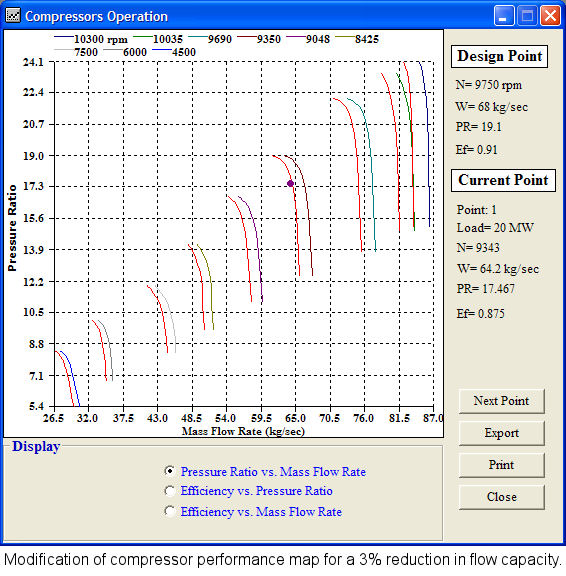
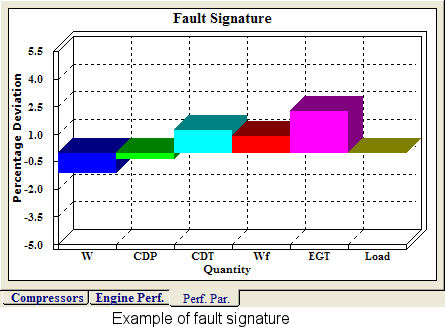
Modifying the performance characteristics of the components simulates different faults. The engine performance for these modified characteristics is then calculated. The deviations from nominal component performance are introduced as percentages in the corresponding section of the main window, and using scalars, multiplying the component performance-parameter effects map modifications. For example, setting the value of modification factor f1 to a value of 0.97 represents a reduction in pumping capacity of the compressor by 3%. The modified component characteristics can be visualized, in comparison to the initial intact ones. When such a calculation is performed in addition to all the cycle variables, ‘fault signatures’ are also calculated and displayed. This ability can for example be used to show that different faults produce different signatures, which could thus be used for fault identification.
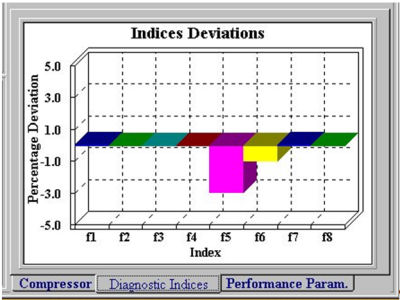
Direct Component Condition Diagnosis
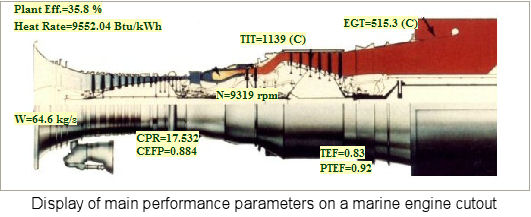
When a set of measurement data is available from an engine with a suspected fault, it is fed to the model in ‘Diagnostic’ mode. The model then calculates the corresponding values of health indices (MF). Changes in MF values indicate the occurrence of a fault. The pattern of change of MFs can then be used to help identify the fault itself. A display of the model output for diagnostic application is shown in the Figure below. The results of this figure come from an engine with a turbine suffering a deterioration, which led to a 3% reduction in swallowing capacity and 1% efficiency reduction.